How to build a size chart for your clothing brand
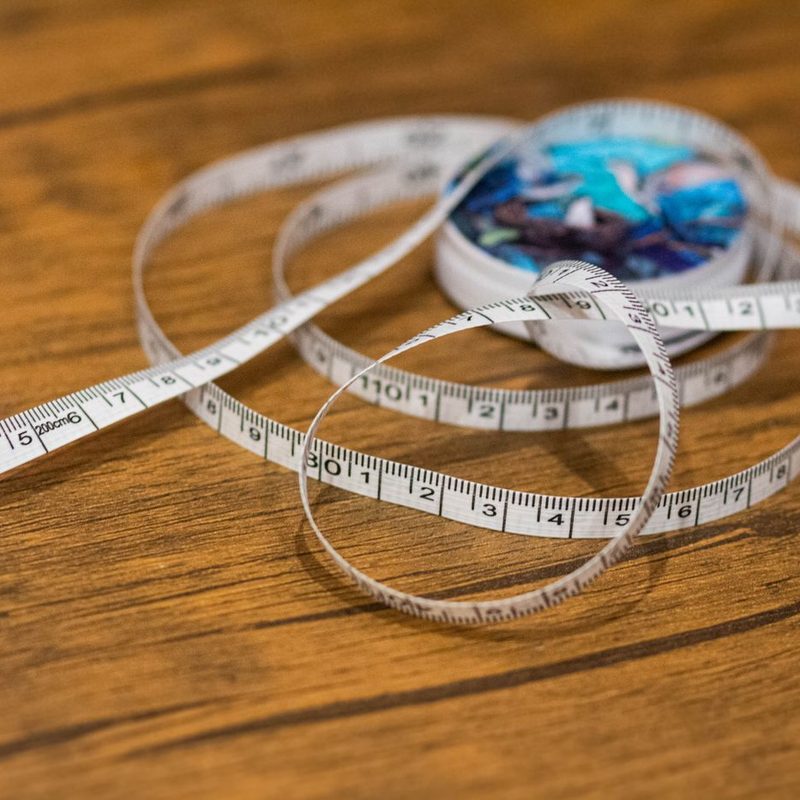
A size chart is one of the cheapest ways to cut returns, and one of the most commonly botched. Most charts published by small brands are copied from a supplier catalog, which means they describe a garment nobody in the company has measured. Here is how to build one that matches what you actually sell.
Start with garment measurements, not body measurements
These are two different charts and they get mixed up constantly. Garment measurements describe the flat product: chest width, body length, sleeve length, shoulder width. Body measurements describe the customer: bust, waist, hip, height. Your product page needs the garment chart, because that is what the customer receives. A body chart is a helper, usually a note about how the garment fits or a model reference.
Pick your points of measure and stay consistent
For a t-shirt, measure chest 2.5cm below the armhole across and double it, body length from high point shoulder to hem, shoulder width seam to seam, sleeve length, and hem width. For a hoodie, add hood height and cuff opening. Write down exactly where each tape goes. If one person measures chest at the armhole and another measures 3cm below it, your chart is off by 2cm before you publish it.
- Lay the garment flat, no stretch, on a hard table.
- Measure to the nearest 0.5cm and record chest and waist as half the circumference.
- Measure three pieces per size, not one. Use the average.
- Record the tolerance, usually plus or minus 1cm on knits and 0.5cm on wovens.
Grade properly instead of guessing
Grading is the step increase between sizes. For adult knits, chest width usually goes up 5cm per size, body length 2cm, and sleeve length 1.5cm. If your supplier sends a chart where every size grows by 4cm in the chest and 4cm in length, someone made it up over lunch. Ask for the grading rule in writing, then check the sample set against it.
Fit it on real bodies, then adjust the chart
Numbers on a sheet do not tell you if a shirt looks right. Put the sample on two or three people in your target size range and take photos from the front, side, and back. Look for the shoulder seam landing on the shoulder point, the hem sitting where you intended, and the sleeve ending at the wrist bone. Where the fit feels wrong, change the pattern, then re-measure. Do not change the chart to match a bad sample, because that just hides the problem.
Where charts usually go wrong
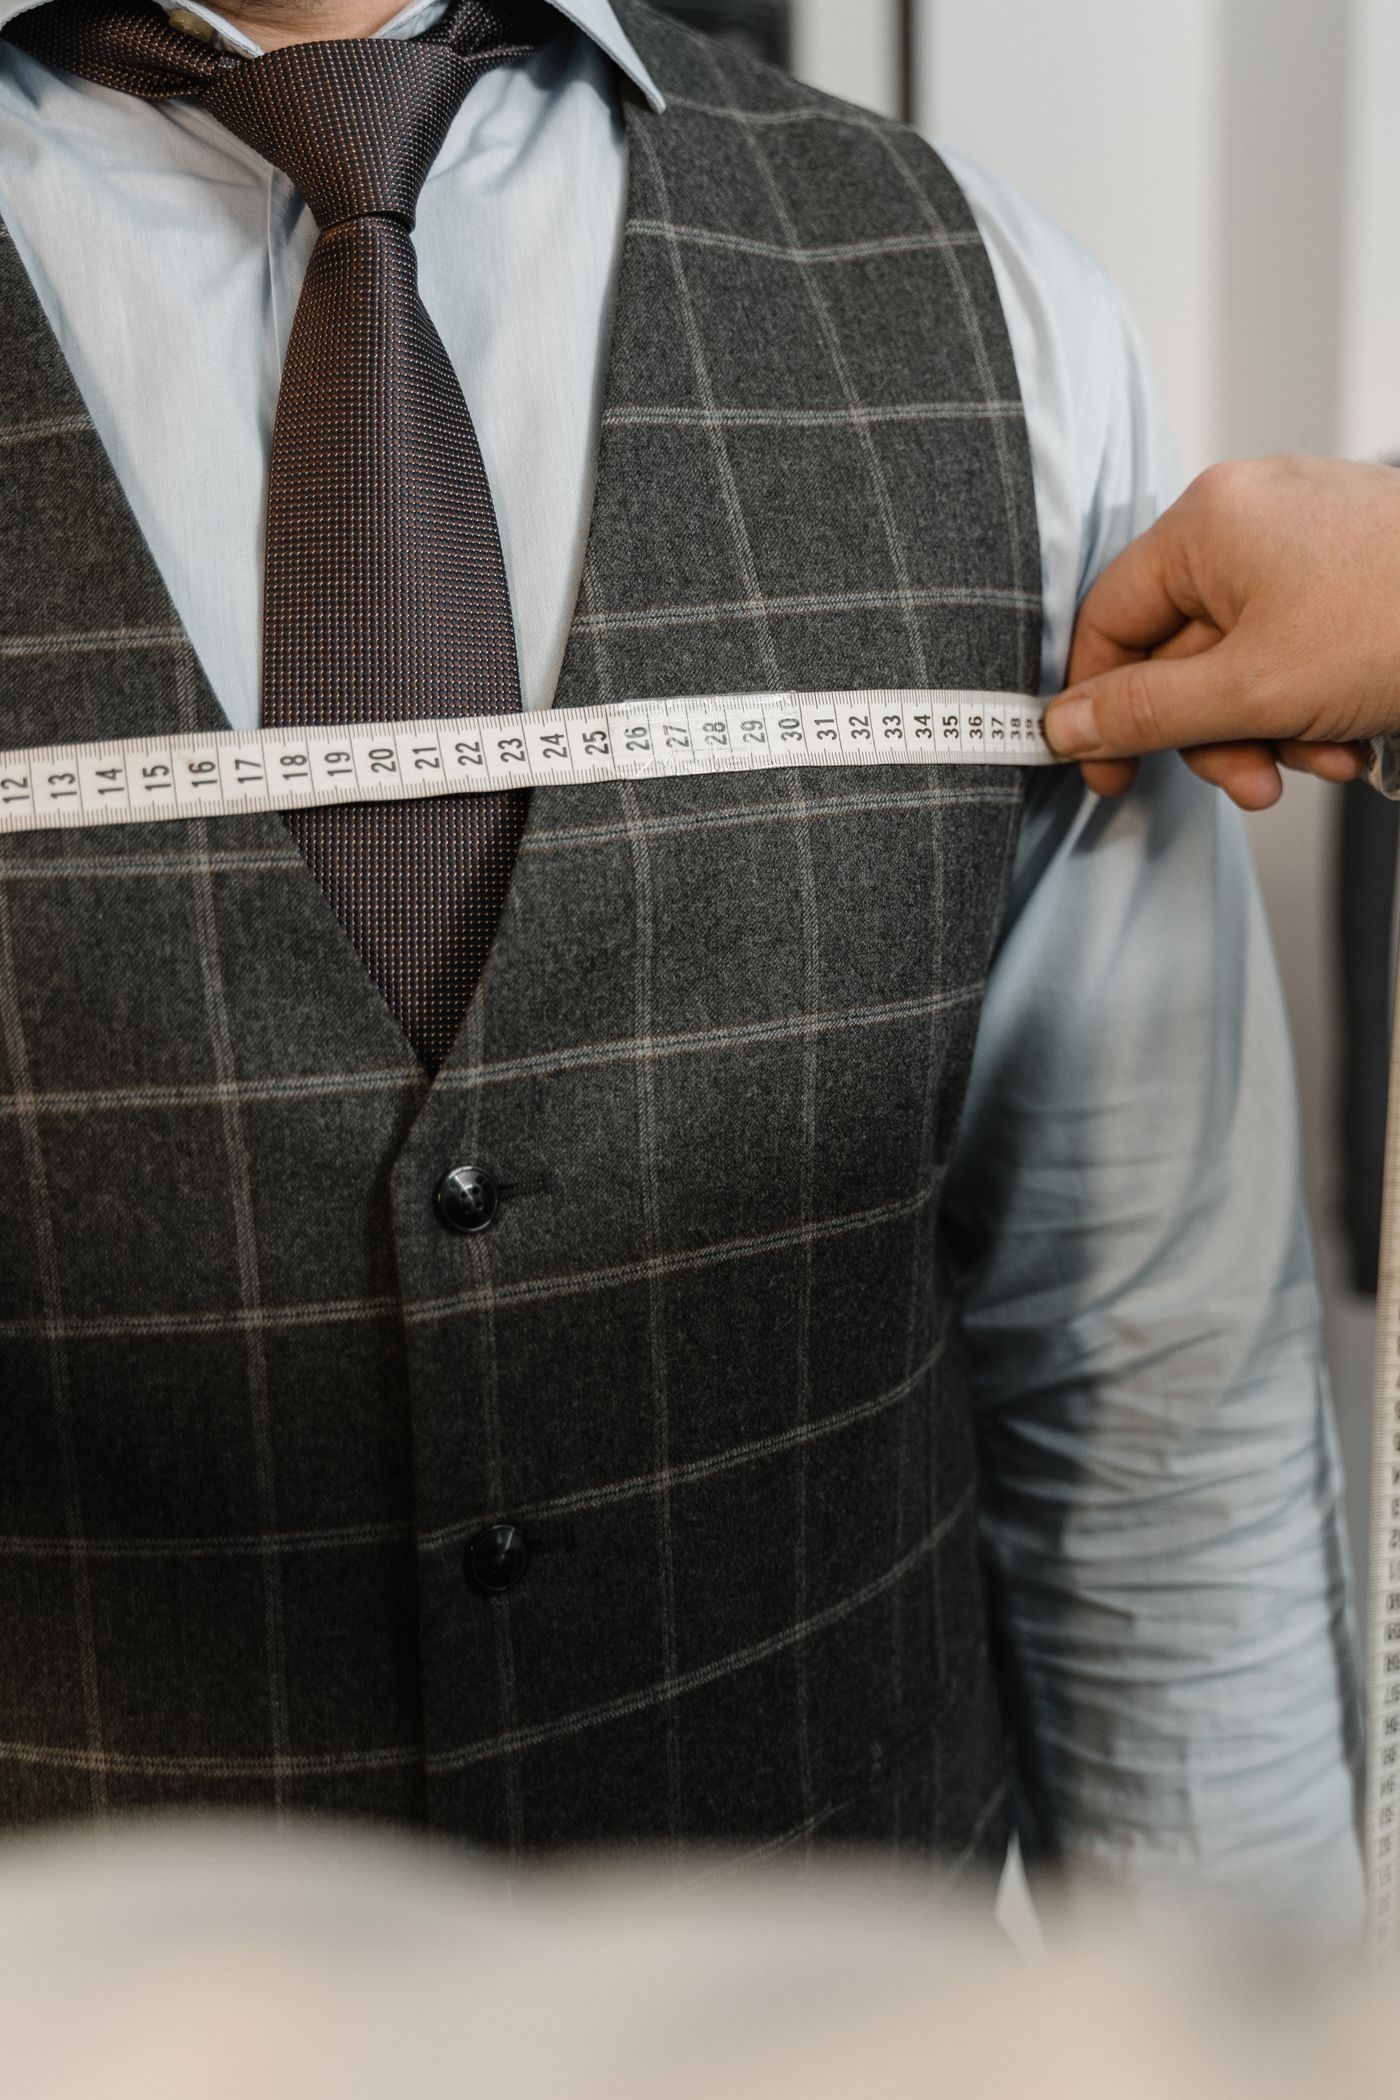
Three mistakes show up again and again. The first is publishing body measurements and calling them garment measurements, which makes every shirt look 8cm too small. The second is measuring one sample and treating it as the standard, when that sample was sewn by the best operator on the line. The third is leaving out the tolerance, so a customer who measures their own shirt and gets 58cm against your 56cm thinks you lied.
There is also a range problem. If your size run stops at XL but your customers are heavier than the fit model, the chart is technically correct and commercially useless. Look at your actual order data before you decide the size range for the next drop.
Publish it in a way people can use
Show both centimetres and inches. Put the chart in a table with one row per size and one column per measurement point. Add a note on how the garment fits compared to a standard size, and state the model's height and the size they are wearing. On mobile, a table that scrolls sideways gets ignored, so keep it to five or six columns.
Then watch your returns. If 40 percent of returns for one style are too small, the chart or the grading is wrong, not the customer. Pull the return reasons monthly and compare them to the size sold. That loop is worth more than any sizing quiz you can install on the site. Recheck the chart every time you change fabric or supplier, because a different mill's fleece shrinks differently and your measurements will drift.
Ready to start your brand?
Tell us what you want to make and we'll tell you honestly whether it's worth it.
Contact Us